
In financial charts, a candle, also known as a candlestick, is a visual representation of the price movement of an asset, such as a stock, currency, or commodity, over a certain time period. Each candle represents a specific time frame, such as a day, a week, or an hour. A candlestick is made up of a rectangular body and two thin lines, called shadows or wicks, that extend from the top and bottom of the body. The body represents the opening and closing prices of the asset during the time period, while the shadows show the highest and lowest prices reached.
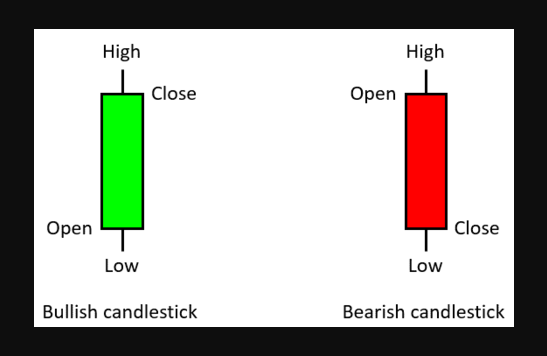
If the candle is green or white, it means that the price of the asset went up during the time period, and the opening price is represented by the bottom of the body, while the closing price is represented by the top of the body. Conversely, if the candle is red or black, it means that the price of the asset went down during the time period, and the opening price is represented by the top of the body, while the closing price is represented by the bottom of the body.
Candlestick charts are widely used by traders and analysts to identify trends, support and resistance levels, and price patterns that can help predict future price movements.
What is trend in candlestick chart
In a candlestick chart, a trend refers to the overall direction in which the price of an asset is moving over a certain period of time. A trend can be defined as an uptrend, a downtrend, or a sideways trend (also known as a range-bound market).
An uptrend is characterized by a series of higher highs and higher lows, where each new high is higher than the previous high, and each new low is higher than the previous low. This indicates that buyers are in control and that the price is likely to continue rising.
A downtrend is characterized by a series of lower lows and lower highs, where each new low is lower than the previous low, and each new high is lower than the previous high. This indicates that sellers are in control and that the price is likely to continue falling.
A sideways trend is characterized by a range-bound market, where the price moves within a certain range without showing a clear direction. This indicates that buyers and sellers are relatively evenly matched, and that the price is likely to continue moving sideways until a breakout occurs.
Traders and analysts use trend analysis to identify trading opportunities, to determine the strength of a trend, and to identify potential trend reversals. Identifying a trend is an important first step in technical analysis, as it provides valuable information about the direction of the market and can help inform trading decisions.
How to identify trends using Candlestick Charts
Identifying trends using candlestick charts involves looking at patterns of candlesticks to determine whether the price of an asset is trending up, down, or sideways. Here are some steps to follow:
Determine the time frame: First, choose a time frame that you want to analyze. This could be a day, a week, a month, or any other time period that you are interested in.
Look for patterns: Scan the candlestick chart for patterns that may indicate a trend. For example, if you see a series of green or white candles with small shadows, this could indicate an uptrend. Conversely, if you see a series of red or black candles with small shadows, this could indicate a downtrend. A series of candles with long shadows and small bodies could indicate indecision or a potential trend reversal.
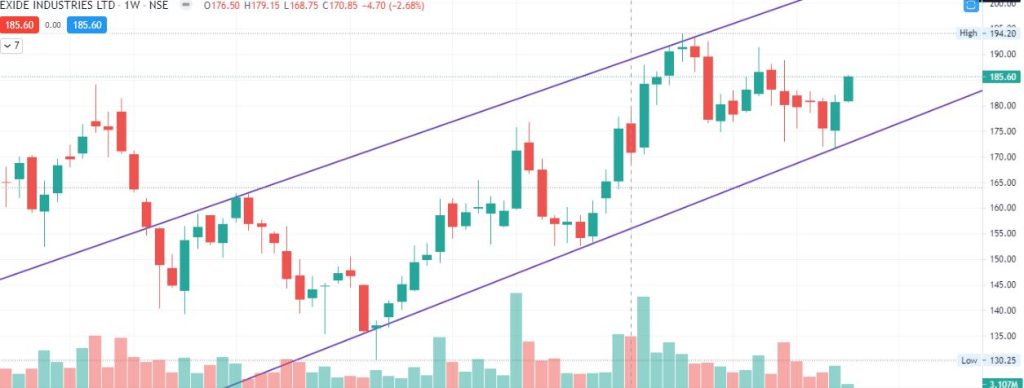
Use trend lines: Draw a trend line to connect the highs or lows of the candles that form the trend. If the trend line is sloping upwards, it indicates an uptrend, while a downwards sloping trend line indicates a downtrend. A horizontal trend line indicates a sideways trend.
Identify support and resistance levels: Support levels are prices at which buying pressure is likely to increase, while resistance levels are prices at which selling pressure is likely to increase. Look for areas on the chart where the price has bounced off a certain level multiple times. These areas could be potential support or resistance levels.
Confirm the trend: Look for other indicators or patterns that confirm the trend you have identified. For example, if you have identified an uptrend, you could look for higher highs and higher lows, as well as other technical indicators such as moving averages or momentum indicators.
It’s important to note that candlestick charts are just one tool in a trader’s toolbox, and should not be used in isolation to make trading decisions. Other factors such as fundamental analysis, news events, and market sentiment should also be taken into consideration.
Here are 20 ways to identify trends in candlestick charts:
- Look for a series of higher highs and higher lows to identify an uptrend.
- Look for a series of lower lows and lower highs to identify a downtrend.
- Look for a sideways trend, also known as a range-bound market, where the price moves within a certain range.
- Use moving averages to identify trends. A moving average that is sloping up indicates an uptrend, while a moving average that is sloping down indicates a downtrend.
- Use trend lines to connect the highs or lows of the candles that form the trend.
- Look for breakouts above or below a trend line to confirm a trend.
- Look for the formation of chart patterns, such as head and shoulders, double top or bottom, or triangles, which can indicate a trend reversal.
- Use price channels to identify trends. A price channel is formed by connecting the highs and lows of the candles that form the trend.
- Look for a sequence of bullish candlesticks, such as white or green candles, to identify an uptrend.
- Look for a sequence of bearish candlesticks, such as black or red candles, to identify a downtrend.
- Look for long candlesticks, with small or no shadows, to identify a strong trend.
- Look for candlestick patterns, such as harami, engulfing, or piercing patterns, to confirm a trend.
- Look for gaps in the price chart, which can indicate a trend continuation or a trend reversal.
- Look for the formation of trend continuation or reversal patterns, such as flags, pennants, or wedges.
- Use the Relative Strength Index (RSI) to identify overbought or oversold conditions, which can indicate a potential trend reversal.
- Use the Moving Average Convergence Divergence (MACD) to identify trend direction and momentum.
- Use the Average Directional Index (ADX) to identify trend strength.
- Look for support and resistance levels, which can indicate trend continuation or reversal.
- Use Fibonacci retracement levels to identify potential levels of support or resistance.
- Look for high trading volume during trend continuation or reversal, which can indicate the strength of the trend.
In the coming few days, we will talk more about Candlestick Pattern, Uptrend, Downtrend and how to get profit using these patters. Stay Tuned !