
Do you want to build your own indicators or your own strategies in stock market for buying or selling a stock based on historical data? Or you simply want to see what was the price of a particular stock 2 months back and 3 months back? Historical Stock Data using Google Spreadsheet is very easy or you can opt for some paid software or you have a broker account which shows chart on screen. So here is a better way to achieve this, using Google finance.
Google Finance along with Google Spreadsheet can solve your problem of fetching historical data for any stock. And you can do your own calculation or research based on the historical data. Best part of this setup is you don’t need to manually update data every day. It updates by itself giving you fresh data every time you open your spreadsheet. That too without any overhead on your computer or without delays.
I will here explain you how to fetch historical data for any stock listed on National stock exchange India. However you can do it for any exchange supported by Google Finance. All you need is Google Account, access to Google drive and some basic knowledge of excel or Google Spreadsheet. Let’s say we want to Fetch 20 days historical data of Infosys limited which is listed on NSE. Which includes Open, High, Low, Close and volume of the day, the method described here is perfect for you.
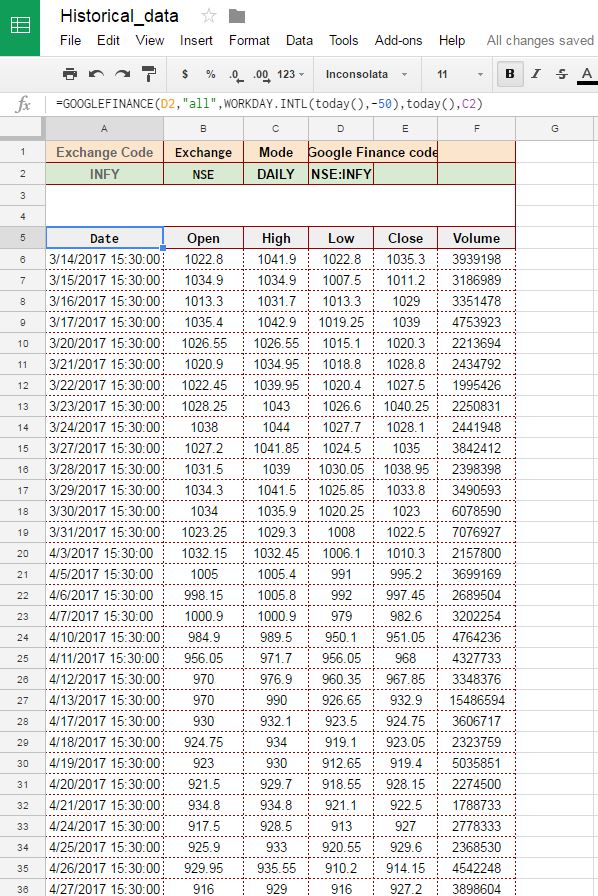
The above screenshot is taken from the spreadsheet I created to pull historical data from Google finance sheet. In this you have to provide Stock Code, Exchange code and frequency of data you want to pull (daily or weekly). Rest everything is taken care by Google by simply passing these values to GOOGLEFINANCE Function in build in Google Spreadsheet.
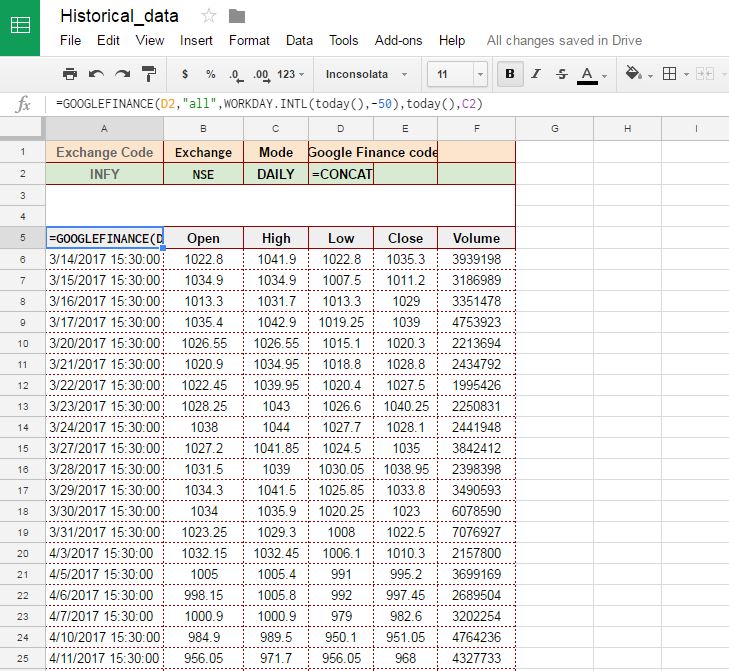
Formula used here which is written in cell A5 is =GOOGLEFINANCE(D2,”all”,WORKDAY.INTL(today(),-50),today(),C2). There is another formula used in spreadsheet to construct the Google finance code (cell D2) from given input which is =CONCAT(B2,”:”,B1). Which gives value in D2 = “NSE:INFY”, which is google finance code for Infosys ltd listed at National Stock Exchange.
First Argument to function GOOGLEFINANCE() is Google finance code of Stock required which is referred from Cell D2.
Second argument here is “All”, this returns all price values along with volume for the day, which includes Open Price, High Price, Low Price and Close price. In case you don’t need all of these you can change this argument to get desired values.
The third and fourth argument are from date and to date. You can pass date dynamically like we did here to get auto updating data. Or you can mention specific dates in case you need data for those dates only.
Here also please note that end date or to date is optional but if you don’t specify the function will return only 1 day data for specified date.
Last argument used is for period of data fetched, it can be either weekly or Daily data.
Now as you have data fetched, you can do whatever calculation you want on these data, but wait before we end this tutorial have you noticed Google Finance is giving data in reverse order that is latest data in last?
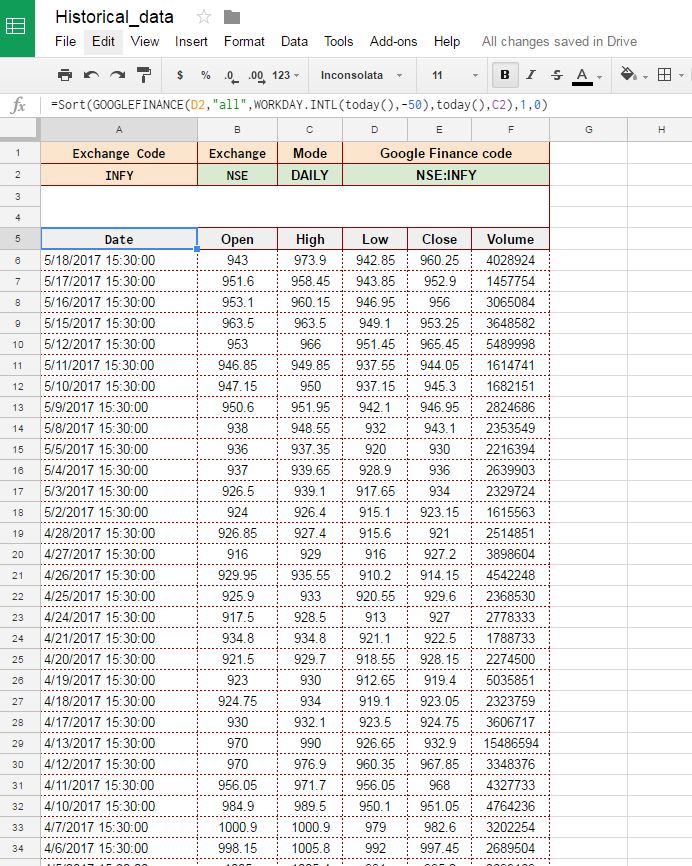
Well this can be solved by simply putting Sort on top of Google finance query. See the above screenshot. We used following formula instead of originally mentioned above to achieve this –=Sort(GOOGLEFINANCE(D2,”all”,WORKDAY.INTL(today(),-50),today(),C2),1,0), as shown in above screenshot.
Hope you liked this tutorial, in next tutorial we will show you how to calculate simple moving average using this data. Stay Tuned!
In case you guys want to see the spreadsheet live used in this tutorial, do leave a comment will share the link if anyone is interested.
This is useful for daily trading or cash and carry forward trading. historical data helps to track the stock too much efficient way… Thank you.
Please could you send me a copy of the tutorial? I’m having issues getting the formulae to work.
Thanks,
Owain
can you share the spreadsheet
looks fantastic 😀
HELLO
Kindly this google spreadsheet to email
rakavies@gmail.com
thanks
ravichandran
how can find any ‘stock previous close historical data’ or stock daily change price historical deta
Looks like given formula isn’t supported anymore. Formula which is currently working with google finance is only this one “=GOOGLEFINANCE(D2)”. Kindly let me know if that’s not a case.
Great find – been looking to do this for some time.
I’ve had some challenges with the share price name here in the UK. You indicate prefixing yours with NSE to get the write share and I’ve trie4d prefixing with LSE and suffixing with .L to get UK shares and the .L works for some.
Do you know what the suffix should be for UK Stock exchange?
Hello – any way you could post a copy of the sheet? Thanks!
Hi, could i get a link to the spreadsheet?
Thanks
Please Could you send me the copy of tutorial, I too having issues, formula not working.
Thank You
Vel
Please could you send me a copy of the tutorial?
can you share
hi
i am working with this formula
=max(query(GOOGLEFINANCE(B9,”close”,A9,AK9),”Select Col2″))
this gives me the higher price within the period between a9 and ak9 for the stock b9,
question is how do i get to show the date inn the next column when the higher price occurred
thank i advance
bets regards
eduardo
hi.
Your work is awesome and I am looking for this kind of data. However I am getting Formulae parse error while creating the sheet.
Can u please help me with the correct query for pulling historical data of any stock into the spread sheet.
It really awesome, but i need LTP (Last trading price) column in the results..is it possible to get that.
Please could you send me the link of the tutorial? Thanks a lot!
Please could you send me a copy of the tutorial? I’m having issues getting the formulae to work.
Thanks,
Please send me the link to the spreadsheet live used in the “How to Pull Historical Stock Data” tutorial
SIR I WAS UNABLE TO DOWNLOAD THE HISTORICAL DATA IN MY GOOGLE SHEET IT IS GETTING ERROR