
Do you know that you can manage portfolio using Google Spreadsheet online. Many of us must be using Google drive as online repository or backup space for storing our files and sharing them with friends and relative. But very few of us know the fact that Google drive is not just a repository. But a cloud based application which can do wonders for you. It has lots of feature apart from having online spreadsheet and doc and. Also, you can even do scripting and run those scripts online on Google server anytime of the day without keeping your computer on.
Today in this post we are going to discuss one of such feature of Google Drive using Google spreadsheet. It’s managing and tracking your stock portfolio in real time. Yes you heard right you can manage and track your stock using Google spreadsheet in real time.
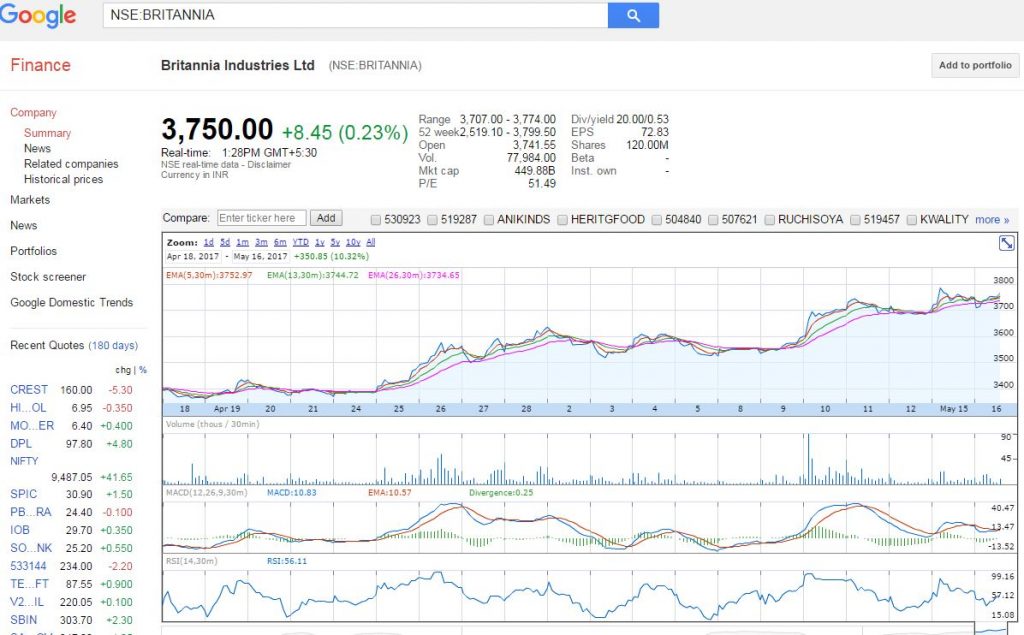
Google offers Finance (www.google.com/finance) as a site which keeps track of stock listed on many of the top stock exchanges across world. And also shows their real-time price along with historical price on their portal. Google spreadsheet has capability to import same data. It show them in a spreadsheet and on top of that you can do your own calculation.
To start tracking your portfolio stock in real time all you need is a Google account. And some free space available in your Google drive to create sheet and fill data in it.
Look at screenshot below which shows you how your Google spreadsheet will look like when you prepare it for Tracking your Portfolio of NSE / BSE Stocks.
I have given below explanation of each Column in order they are Important —
Column A — It’s constructed based on value in Column B & C using formula =CONCATENATE(B3,”:”,C3). It is a simple excel formula and self explanatory I believe.
Column B — It shows which exchange your stock of interest is listed on. We are talking about only NSE/BSE stock. But you can track any exchange supported by Google Finance. For National Stock Exchange Enter “NSE” and for Bombay Stock Exchange enter “BOM”.
Column C– It holds stock code from Stock Exchange. NSE Stock Code is alphanumeric whereas BSE Stock Codes are 6 Digit Numbers only.
Column D– It contains name of company, you can remove this column. If you are comfortable having only Stock Codes, it’s totally up to you whether you need this column or not.
Column E — You can enter here your buy price of particular stock. This will be used in calculating your current profit and value of stock over buy Price/value.
Column F — You should enter here Quantity you bought. You can enter 0 as well if you just want to put stock in tracking but have not bought yet. Again, this will be used in calculating your current profit and value of stock over buy Price/value.
Column G — Date when you bought the stock,. This can be optional but can be used to compute CAGR or days of holding.
Column H– It simply provides a direct link to Google finance site for your stock. In case you want to see chart or verify data this can be used. Formula for this cell =HYPERLINK(“https://www.google.com/finance?q=”&A3,”CHART”).
Column I– This column actually fetches data from Google server using Google finance server in spreadsheet using function GOOGLEFINANCE(). Formula in this cell is =GOOGLEFINANCE(A3,”price”). This will show current price if market is open otherwise the last traded price. In spreadsheet we used if condition as well to avoid null values being shown if there is no code present in Column A.
Column J– This again fetches data from Google finance server. And shows today’s change in price in terms of percent. If market is open it shows live data if Market is closed it will show change in pricing on last trading day.
Column K — This calculates total Profit / Loss based on current price, buy price and quantity you entered in previous columns in terms of percent.
Column L — This shows calculated Buy value of shares based on Buy Price and Quantity.
Column M– This shows calculated value of shares based on Current Price and Quantity you bought.
Column N — This calculates total Profit / Loss based on current price, buy price and quantity you entered in previous columns in absolute value.
Column O –– Can be used as comment column to enter anything you want to as comment or notes for future reading.
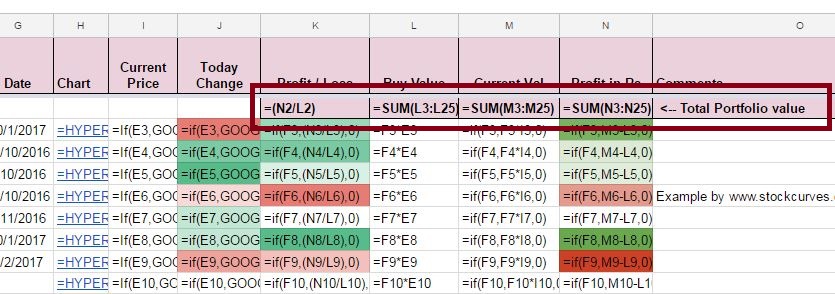
Row 2 and Column K-N are used for calculating entire portfolio value in terms of value and in percent. Formulas used are shown in above screenshot. This are all simple mathematical formulas used in any spreadsheet.
Well this was all about how to maintain portfolio and track stock using google spreadsheet. There are many more things related to stock market which can be done using google spreadsheet. We will share them soon on this platform, till then stay tuned.
In case you guys want to see the spreadsheet live used in this tutorial, do leave a comment will share the link if anyone is interested.
Update : In case you want to see excel live and make a copy of it for yourself use following URL or Click here
https://docs.google.com/spreadsheets/d/1f-LhVPQ1k5IXFm3gqyO3DlTW4dS4KgOCcwVurLgCO5U/edit?usp=sharing
You want to learn How to calculate Exponential Moving Average in Spreadsheet, then follow the link.
Great Post , i did not knew that it is possible …
Good Post. Pls give me the link for the spread sheet
Link Updated in post
Great info! I’m noodling with Google Sheets & Google Finance. I can’t get the Chart Link right per this example. Maybe you can send me the link to your sheet. Thanks
Link Updated in Post
Can you send me the excel sheet which i can build on?
Ramesh
Link Updated in post
It is observed that googlefinance() does not take into account the price variations due to issue of bonus shares
For example,Wipro issued 1:1 bonus shares with ex date as 13 June, 2017
An extract from NSE website on price movement is quoted here
Symbol Series Date Prev Open High Low Last Close
Close Price Price Price Price Price
WIPRO EQ 09-Jun-17 545.9 544.05 544.05 531.6 537 536.95
WIPRO EQ 12-Jun-17 536.95 535.6 535.6 520.65 524.4 526.35
WIPRO EQ 13-Jun-17 526.35 260 266.7 256.75 258.85 259
WIPRO EQ 14-Jun-17 259 261.3 261.3 252.3 256.9 256.1
WIPRO EQ 15-Jun-17 256.1 260 261.9 255.05 260.1 260.85
The same values returned by googlefinance() is quoted below
=googlefinance(“nse:wipro”,”close”,date(2017,6,9),date(2017,6,15),”daily”)
Date Close
09/06/2017 15:30:00 268.5
12/06/2017 15:30:00 262.2
13/06/2017 15:30:00 258.85
14/06/2017 15:30:00 256.9
15/06/2017 15:30:00 260.1
I would like to have your opinion on this.
Actually it is other way… Google finance have adjusted historical price as per the latest equity base. For technical analysis to work correctly you need to adjust price the same way Google finance did…
e.g. if you calculating EMA14 and very next day of bonus the EMA value will be wrong if you don not adjust price as done by Google finance. So in my opinion it is correct way for anyone giving analysis tool.
NSE obviously wont adjust price as they have to give correct values not technically correct values.
Very useful for me. I made it with my portfolio… Thanks a lot
HOW TO ADD SCRIPS SIR. PLSE REPLY
Hi,
Thanks for the post, very nice and prices get updated on realtime basis. Could you help me in getting the option chain of NIFTY OR BANKNIFTY on Google sheets?
Let me know, if it is possible.
Thanks,
Dilip