How to Identify Trend in Candlestick Chart

Stock in Uptrend - Exide Weekly chart as of March 2023

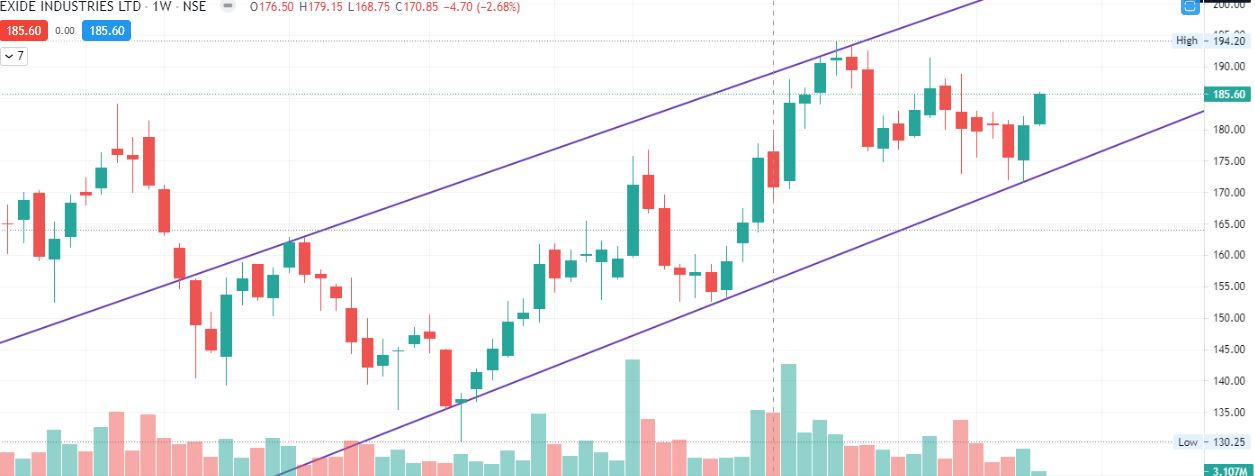
In financial charts, a candle, also known as a candlestick, is a visual representation of the price movement of an asset, such as a stock, currency, or commodity, over a certain time period. Each candle represents a specific time frame, such as a day, a week, or an hour. A candlestick is made up of a rectangular body and two thin lines, called shadows or wicks, that extend from the top and bottom of the body. The body represents the opening and closing prices of the asset during the time period, while the shadows show the highest and lowest prices reached. If the candle is green or white, it means that the price of the asset went up during the time period, and the opening price is represented by the bottom of the body, while the closing price is represented by the top of the body. Conversely, if the candle is red or black, it means that the price of the asset went down during the time period, and the opening price is represented by the top of the body, while the closing price is represented by the bottom of the body. Candlestick charts are widely used by traders and […]

Morepen Lab – Technical Breakout today

Morepen Lab is manufacturer of wide range of API products for Pharma company and also have works in developing wide range of Home health care products like BP Monitor, Glucometer and other portable home health care product. Recently they announced that they will be separating their device production business and pharma business in 2 separate arms and post that Stock was continuously falling in Trading market, however the news was supposed to be positive. After a long consolidation today it seems Morepen Lab started moving back up in last few days and todays move is triangle breakout which may give good return in next few days. Look at chart below and decide yourself. This is not a buy or sell recommendation. This post is made just for knowledge sharing. Please consult financial advisor before taking any trade.

How to Calculate Exponential Moving Average using Excel or Google Spreadsheet

Variuos EMA Calculations In Spreadsheet

Earlier we told you how to pull historical data in Google spreadsheet (see — HOW TO PULL HISTORICAL STOCK DATA FROM USING GOOGLE SPREADSHEET ) Once you have Historical data available in Google spreadsheet we can calculate Exponential Moving average and values of various technical indicators of our interest using the same. In this tutorial we going to calculate Exponential Moving Average for given time period using historical data available to us from Google Finance. EMA or Exponential moving average is also very similar to Simple Moving average, but Simple moving average has little affect of sharp uptrend or Downtrend on current Moving average, to address this issue, Exponential moving average is taken as it gives more weightage to current price or latest price and older prices have less weightage in calculation. Hence EMA moves a little faster when price changes rapidly. In technical analysis of Share prices, EMA are more popular than Simple Moving average for short term price movement prediction because of this change in way these 2 averages are calculated. Hence Most popular EMA among traders are for short term which are for less than 50 days more specifically 12 days to 26 days EMA prices are […]

Calculate Simple Moving Average Using Google Sheets

Various SMA Calculated in Excel

Earlier we told you how to pull historical data in Google spreadsheet (see — HOW TO PULL HISTORICAL STOCK DATA FROM USING GOOGLE SPREADSHEET ). Once you have Historical data available in Google spreadsheet we can Calculate Simple Moving Average and values of other various technical indicators of our interest using the same. The method given here can be used in Excel as well as Google Sheets. However we have given formulas for Google sheet. In case you wish to do same in Excel you can achieve same result by importing historical data (by Any means) and then using these formulas (some minor modification in syntax of formula may be required). Today we are going to look how to calculate Simple Moving average or SMA for a particular period. SMA is nothing but average of last N number of Prices where N denotes the period. So if you want to calculate SMA(20,C) i.e. Simple Moving average of closing price of 20 day period. You can simply sum last 20 Close price and divide by 20, and you will get the SMA (20, C). Similarly SMA can be calculated on Open High or Low with any period, a screenshot with formula […]

How to Pull Historical Stock Data using Google Spreadsheet

Historical Data for NSE

Do you want to build your own indicators or your own strategies in stock market for buying or selling a stock based on historical data? Or you simply want to see what was the price of a particular stock 2 months back and 3 months back? Historical Stock Data using Google Spreadsheet is very easy or you can opt for some paid software or you have a broker account which shows chart on screen. So here is a better way to achieve this, using Google finance. Google Finance along with Google Spreadsheet can solve your problem of fetching historical data for any stock. And you can do your own calculation or research based on the historical data. Best part of this setup is you don’t need to manually update data every day. It updates by itself giving you fresh data every time you open your spreadsheet. That too without any overhead on your computer or without delays. I will here explain you how to fetch historical data for any stock listed on National stock exchange India. However you can do it for any exchange supported by Google Finance. All you need is Google Account, access to Google drive and some […]