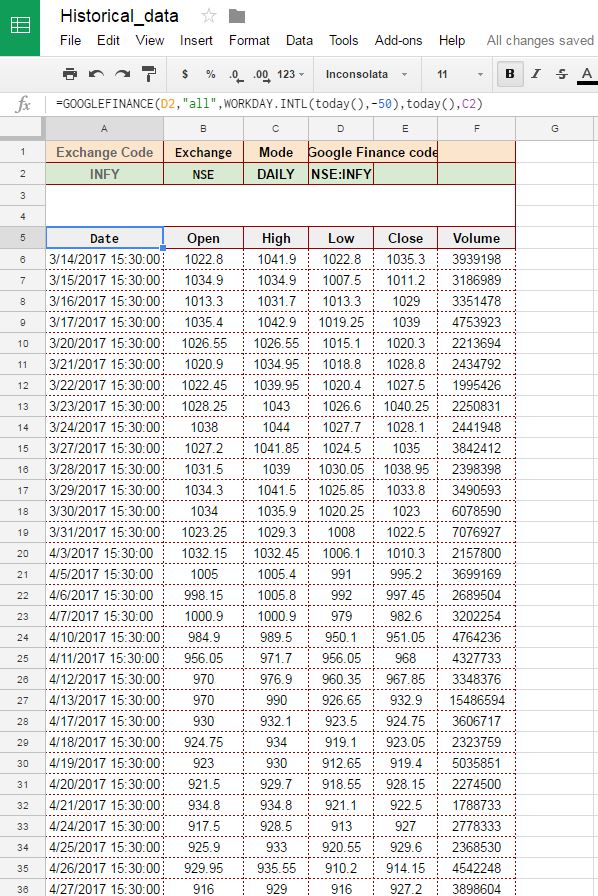
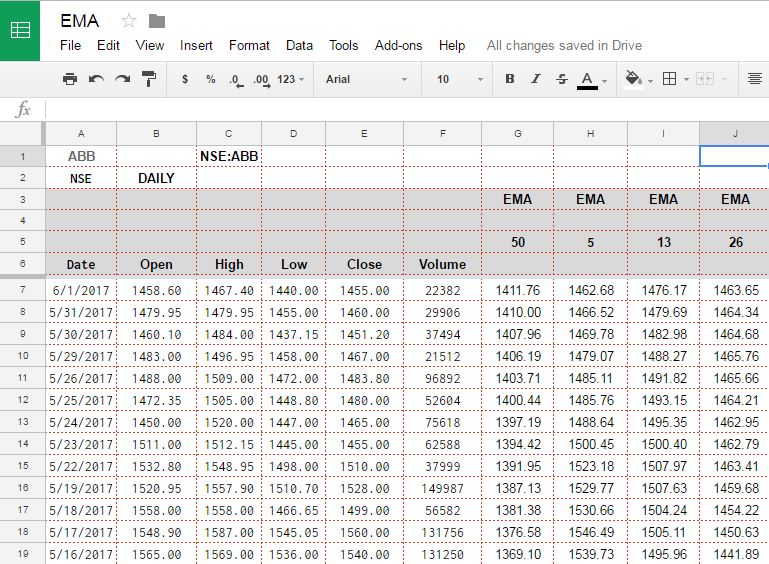
Earlier we told you how to pull historical data in Google spreadsheet (see — HOW TO PULL HISTORICAL STOCK DATA FROM USING GOOGLE SPREADSHEET ) Once you have Historical data available in Google spreadsheet we can calculate Exponential Moving average and values of various technical indicators of our interest using the same. In this tutorial we going to calculate Exponential Moving Average for given time period using historical data available to us from Google Finance. EMA or Exponential moving average is also very similar to Simple Moving average, but Simple moving average has little affect of sharp uptrend or Downtrend on current Moving average, to address this issue, Exponential moving average is taken as it gives more weightage to current price or latest price and older prices have less weightage in calculation. Hence EMA moves a little faster when price changes rapidly. In technical analysis of Share prices, EMA are more popular than Simple Moving average for short term price movement prediction because of this change in way these 2 averages are calculated. Hence Most popular EMA among traders are for short term which are for less than 50 days more specifically 12 days to 26 days EMA prices are […]